A ubiquitous contamination in every sip.
No one asked for a garnish of plastic in their beer. Yet that’s what researchers in France have found in an alarming survey of 63 popular drinks: from sparkling water to wine, iced tea to cola. Every single beverage was laced with microplastics — plastic fragments smaller than 5 millimeters, invisible to the eye and everywhere in the bottle.
The study measured contamination levels ranging from 2.9 ± 0.7 MPs per liter in mineral water to 82.9 ± 13.9 MPs/L in beer. Soda samples averaged 31.4 MPs/L, iced tea 28.5, lemonade 45.2, and wine 8.2. But the headline shocker wasn’t the diversity of drinks contaminated — it was the discovery that glass bottles harbored the highest levels.
When glass does worse than plastic
Glass has long been the favored option for eco-conscious consumers. It’s inert, endlessly recyclable, and free of plastic’s many chemical leachates. But the study found that a cola in a glass bottle contained up to 103.4 MPs/L, compared to just 2.1 MPs/L in plastic.
The culprit? Not the glass itself, but the metallic closure cap, painted with polyester-based coatings. These painted caps, used almost universally on glass bottles, are shedding microplastics into beverages.
Using Fourier-transform infrared (FTIR) spectroscopy, researchers showed that the particles floating in drinks were chemically identical to polyester paints used on bottle caps. In lab simulations, even clean water developed microplastic contamination after being sealed under one of these caps — especially if the cap hadn’t been cleaned.
Rinsing the inside of the caps with an ethanol-water mix reduced plastic release by up to a factor of three. This simple fix isn’t part of any standard bottling protocol today.
Three reasons may explain the “unexpected” presence of this black iceberg in the Arctic
The plastic family tree
Three main categories of plastic particles emerged from the analysis: polyesters (like PET and alkyd resins), polyolefins (such as polyethylene and polypropylene), and polystyrenes (PS and ABS).
- Glass bottles showed a dominance of polyesters, with some beer samples hitting 95.9 MPs/L of this family alone.
- Plastic bottles, ironically, revealed much lower contamination — often under 5 MPs/L — with polyolefins contributing the most.
- Aluminum cans weren’t off the hook but had notably lower contamination rates, likely due to different sealing systems and coatings.
Each polymer’s presence helps reconstruct its source. Polyesters align with cap paint. Polyolefins typically relate to the bottle body. Polystyrenes may derive from production or packaging residue.
Methodical but messy comparisons
The researchers worked under ISO 5 laminar flow hoods, filtered their samples repeatedly, ran both positive and negative controls, and degassed fizzy beverages carefully before testing. Identification of particles down to 30 microns was confirmed using stereomicroscopy paired with µFTIR (ATR mode) — techniques that leave little room for misclassification.
Yet comparing this study to others remains difficult. Protocols differ wildly across the literature: filter types, particle size thresholds, solvents, even drying temperatures. (Heating polyester-rich filters above 104°F can melt or degrade the plastic, skewing the particle counts.)
This particular study analyzed six samples per drink, rather than the three more commonly used. Statistically, that matters — it halves uncertainty and reduces outliers.
A paint chip in your drink
The paint on the cap emerges as an unexpected villain. These coatings, typically made of thermoset alkyd or polyester resins, don’t dissolve — they fracture. During transport or bottling, minor shocks or twists cause flakes to break off, especially around the rim.
Tests revealed:
- A non-cleaned cap could release 287 MPs/L.
- A cleaned cap dropped that to 86 MPs/L.
- Merely rinsing a cap recovered, on average, 47 yellow particles, matching those found later in the beverage.
This points to a mechanical rather than chemical migration: paint chips physically detaching and tumbling into your drink.
Not all brands are equal
There were large differences between brands and drink types. For instance:
Bottled water:
- Brand W3: 5 MPs/L
- Brand W7: 1.5 MPs/L
Cola:
- Brand C2: 76 MPs/L
- Brand C3: under 3 MPs/L
These variations likely reflect differences in bottling processes, cap design, and drink composition. Acidic or carbonated liquids could promote more particle release through agitation or corrosion, though the study didn’t quantify that directly.
Still no regulatory benchmarks
The researchers are cautious: they don’t claim health risks. We simply don’t know what these microplastic levels mean for long-term human health. There are no toxicological thresholds for chronic oral exposure to microplastics, so regulators can’t set exposure limits.
Still, the team suggests practical interventions. Improved cap cleaning and hygiene standards during bottling could dramatically reduce plastic load — without requiring sweeping industry changes.
And perhaps most notably, this study invites a rethink. Glass, long hailed as the cleanest option, might need a closer inspection — not for what it’s made of, but for what it’s sealed with.
Source: : https://anses.hal.science/anses-05066642v1
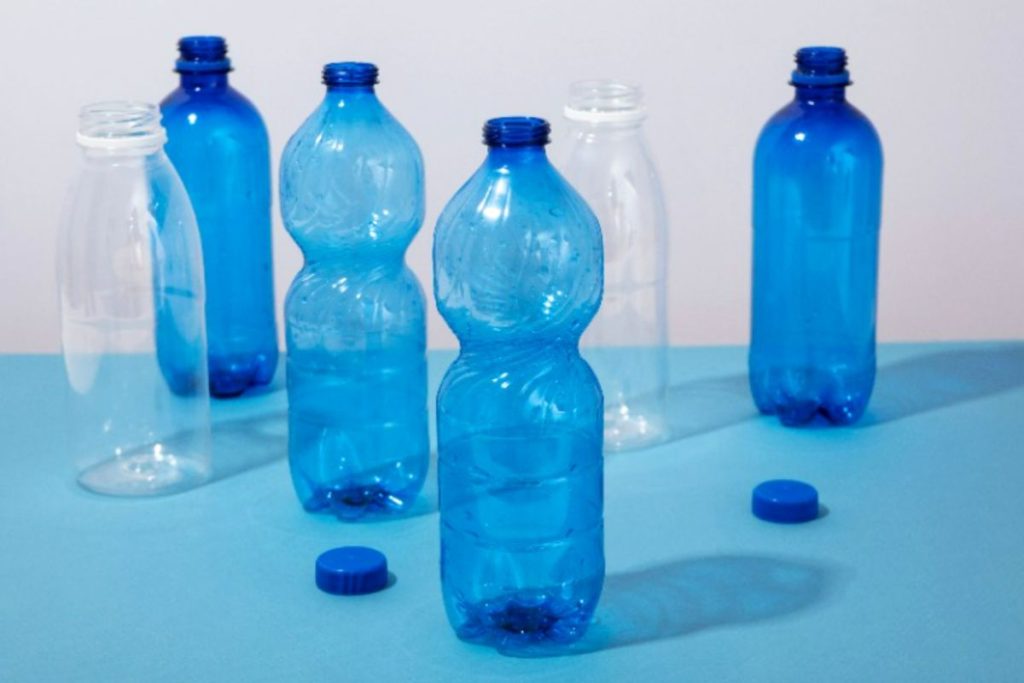
Image: Minimal recycling concept with plastic bottles (Freepik)